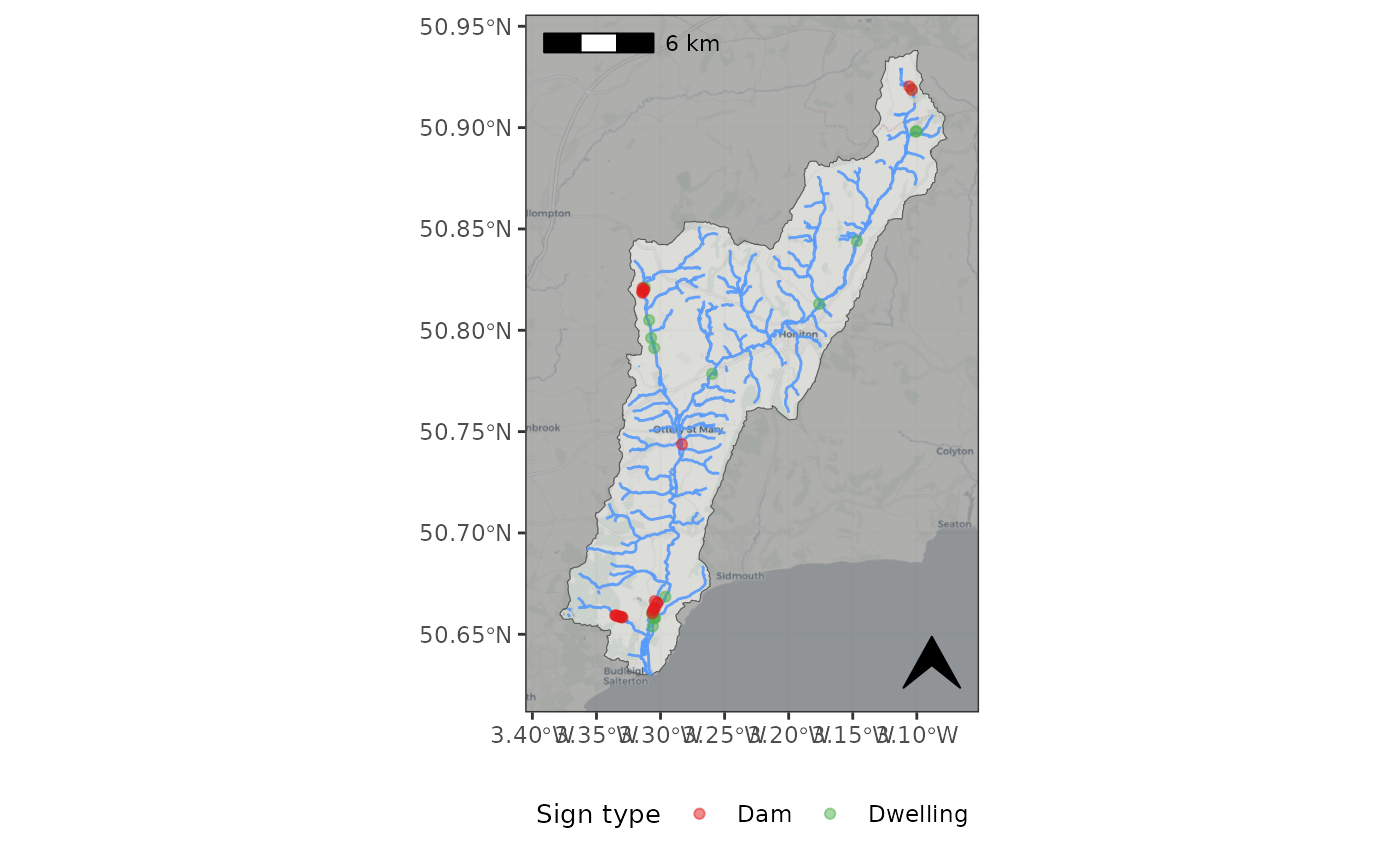
Plotting function for Confirmatory sign (Dwelling and Dam) locations.
plot_other_signs.Rdfunction to create a ggplot for the feeding points or confirmatory signs. This is just a lazy wrapper for
beavertools::plot_territories but tidies things up a bit. It is not exaustive and
Usage
plot_other_signs(
  beav_points,
  size = 2.5,
  fill_col = c("#e41a1c", "#4daf4a", "#d11141"),
  label = FALSE,
  basemap = TRUE,
  basemap_type = "cartolight",
  axes_units = TRUE,
  scalebar = TRUE,
  scalebar_loc = "tl",
  north_arrow = TRUE,
  north_arrow_loc = "br",
  north_arrow_size = 0.75,
  wgs = TRUE,
  guide = TRUE,
  guide_pos = "bottom",
  seed = NA,
  drop_act = FALSE,
  trans_type = NULL,
  catchment = NULL,
  rivers = FALSE,
  plot_extent = NULL,
  mask_fill = "grey50"
)
Arguments
- beav_points
An 'sf' object containing the location of beaver dwellings and dams. Alternative signs will be labelled as 'other'
- size
a numeric vector of length 1 denoting the point size to be used by ggplot2.
- fill_col
character vector of R colours or HEX codes.
- label
label activity areas with polygon ID.
- basemap
Boolean, include an OSM basemap. (optional)
- basemap_type
Character vector for osm map type. for options see
rosm::osm.types()- axes_units
Boolean to include coordinate values on axis.
- scalebar
Boolean to include a scalebar.
- scalebar_loc
character vector for the scalebar location one of:'tl', 'bl', 'tr', 'br' Meaning "top left" etc.
- north_arrow
Boolean to include a north arrow
- north_arrow_loc
character vector for the arrow location one of:'tl', 'bl', 'tr', 'br' Meaning "top left" etc.
- north_arrow_size
numeric vector for the arrow
- wgs
Boolean to transform coordinate reference system (CRS) to WGS84 (EPSG:4326)
- guide
Boolean to include a legend
- guide_pos
character vector describing the desired position of the guide c("left", "right", "bottom", "top")
- seed
numeric seed number -useful if using 'fill_name' = 'ID' as will set the same random colour palette.
- drop_act
Boolean to remove areas classified as 'activity' this creates a plot which shows only possibl and confirmed territories
- trans_type
character - the transformation type to be used if fill_name=c('mean_fd', sum_fd').
- catchment
An sf object or an sf-readable file. See sf::st_drivers() for available drivers. This feature should be a boundary such as a catchment or Area of interest. It is used to mask the map region outside of desired AOI.
- rivers
Boolean to include river lines (downloaded automatcally using the osmdata package) OR a river network of class 'sf' which can be generated beforehand using
beavertools::get_rivers().- plot_extent
'bbox', 'sf' or 'sp' object defining the desired plot extent.
- mask_fill
character vector for the fill colour of the catchment mask.
Examples
# Here we filter the filter the built in 2019-2020 ROBT confirmatory sign data `RivOtter_OtherSigns`
# Then pipe this 'sf' object to plot_feeding.

RivOtter_OtherSigns %>%
dplyr::filter(SurveySeason == "2019 - 2020") %>%
  plot_other_signs(., size = 1.5,basemap=TRUE, catchment = RivOtter_Catch_Area,
                   rivers = TRUE, plot_extent = inflate_bbox(RivOtter_Catch_Area, 200))
#> Warning: attribute variables are assumed to be spatially constant throughout all geometries
#> Warning: attribute variables are assumed to be spatially constant throughout all geometries
#> Zoom: 11