Built in plotting function for territory polygons.
plot_territories.Rdfunction to create a ggplot for the territory zones.
Usage
plot_territories(
  terr_poly,
  fill_name,
  fill_col = c("#7EAAC7", "#F87223", "#61E265"),
  label = FALSE,
  basemap = TRUE,
  basemap_type = "cartolight",
  axes_units = TRUE,
  scalebar = TRUE,
  scalebar_loc = "tl",
  north_arrow = TRUE,
  north_arrow_loc = "br",
  north_arrow_size = 0.75,
  wgs = TRUE,
  guide = TRUE,
  guide_pos = "right",
  seed = NA,
  drop_act = FALSE,
  trans_type = NULL,
  catchment = NULL,
  rivers = FALSE,
  plot_extent = NULL,
  mask_fill = "grey50"
)
Arguments
- terr_poly
a territory polygon created using
beavertools::estimate_territories()- fill_name
a character vector containing the name of the column to be used as the fill aesthetic. choose from: 'terr_status', 'user_class', 'mean_fd', sum_fd' or 'id'.
- fill_col
character vector of R colours or HEX codes.
- label
label activity areas with polygon ID.
- basemap
Boolean, include an OSM basemap. (optional)
- basemap_type
Character vector for osm map type. for options see
rosm::osm.types()- axes_units
Boolean to include coordinate values on axis.
- scalebar
Boolean to include a scalebar.
- scalebar_loc
character vector for the scalebar location one of:'tl', 'bl', 'tr', 'br' Meaning "top left" etc.
- north_arrow
Boolean to include a north arrow
- north_arrow_loc
character vector for the arrow location one of:'tl', 'bl', 'tr', 'br' Meaning "top left" etc.
- north_arrow_size
numeric vector for the arrow
- wgs
Boolean to transform coordinate reference system (CRS) to WGS84 (EPSG:4326)
- guide
Boolean to include a legend
- guide_pos
character denoting the position of the legend c('left, 'right, 'bottom', 'top)
- seed
numeric seed number -useful if using 'fill_name' = 'ID' as will set the same random colour palette.
- drop_act
Boolean to remove areas classified as 'activity' this creates a plot which shows only possibl and confirmed territories
- trans_type
character - the transformation type to be used if fill_name=c('mean_fd', sum_fd').
- catchment
An sf object or an sf-readable file. See sf::st_drivers() for available drivers. This feature should be a boundary such as a catchment or Area of interest. It is used to mask the map region outside of desired AOI.
- rivers
Boolean to include river lines (downloaded automatcally using the osmdata package) OR a river network of class 'sf' which can be generated beforehand using
beavertools::get_rivers().- plot_extent
'bbox', 'sf' or 'sp' object defining the desired plot extent.
- mask_fill
character vector for the fill colour of the catchment mask.
Examples
# Here we filter the filter the built in 2019-2020 ROBT feeding sign data `RivOtter_FeedSigns`
# Then pipe this 'sf' object to forage_density.
ROBT_201920 <- RivOtter_FeedSigns %>%
dplyr::filter(SurveySeason == "2019 - 2020")%>%
forage_density(., 'FeedCat')
#> No value supplied for "kd_extent" argument: default extent will be used
#>
#> calculating weighted kde
# Now we load the ROBT `RivOtter_OtherSigns` dataset and filter to the same
# year as the forage density raster.
CS_201920 <- RivOtter_OtherSigns %>%
dplyr::filter(SurveySeason == "2019 - 2020")
# run territory classification
otter_poly <- estimate_territories(ROBT_201920, confirm_signs = CS_201920)
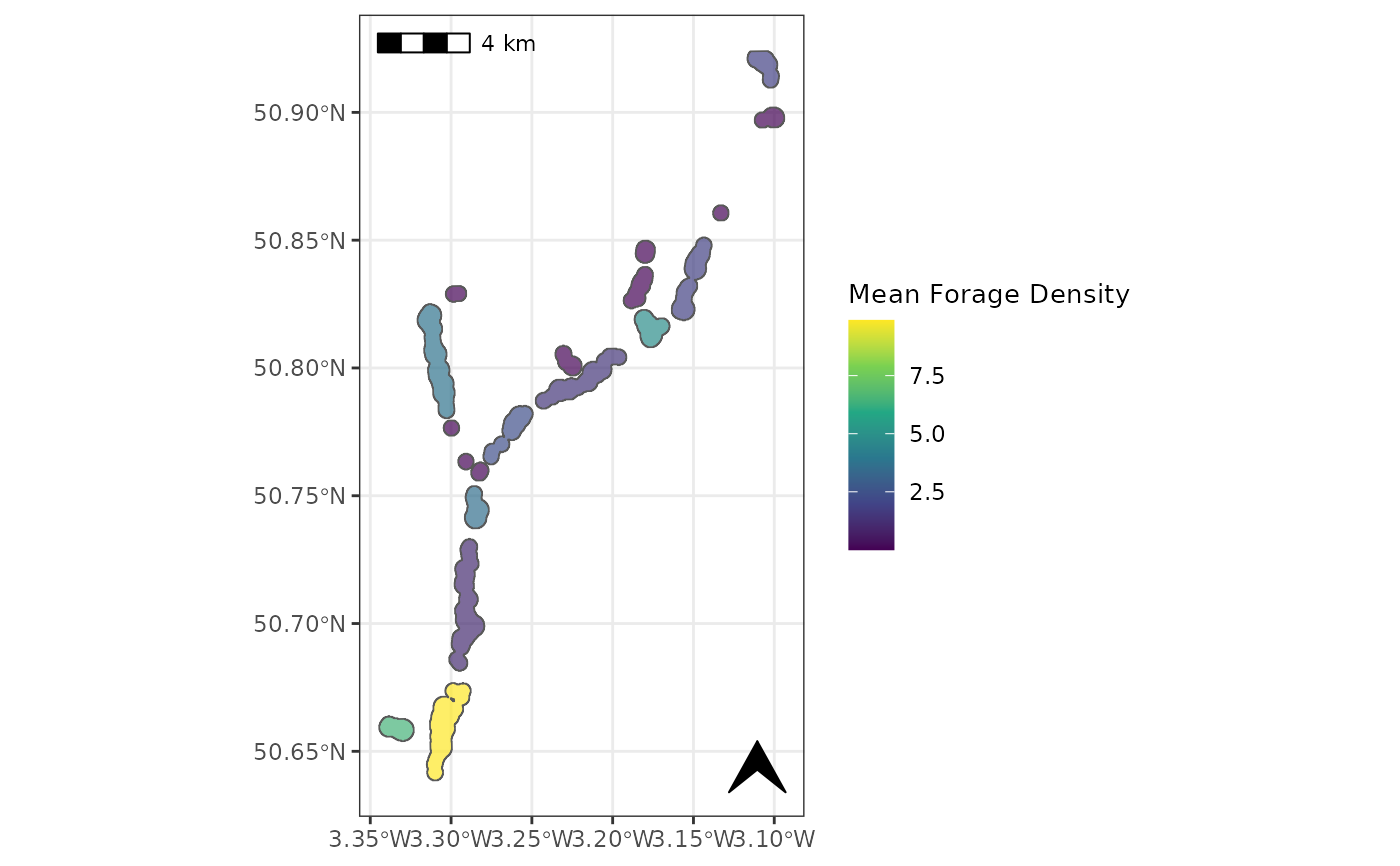
# various options:
plot_territories(otter_poly, 'mean_fd', basemap=FALSE)
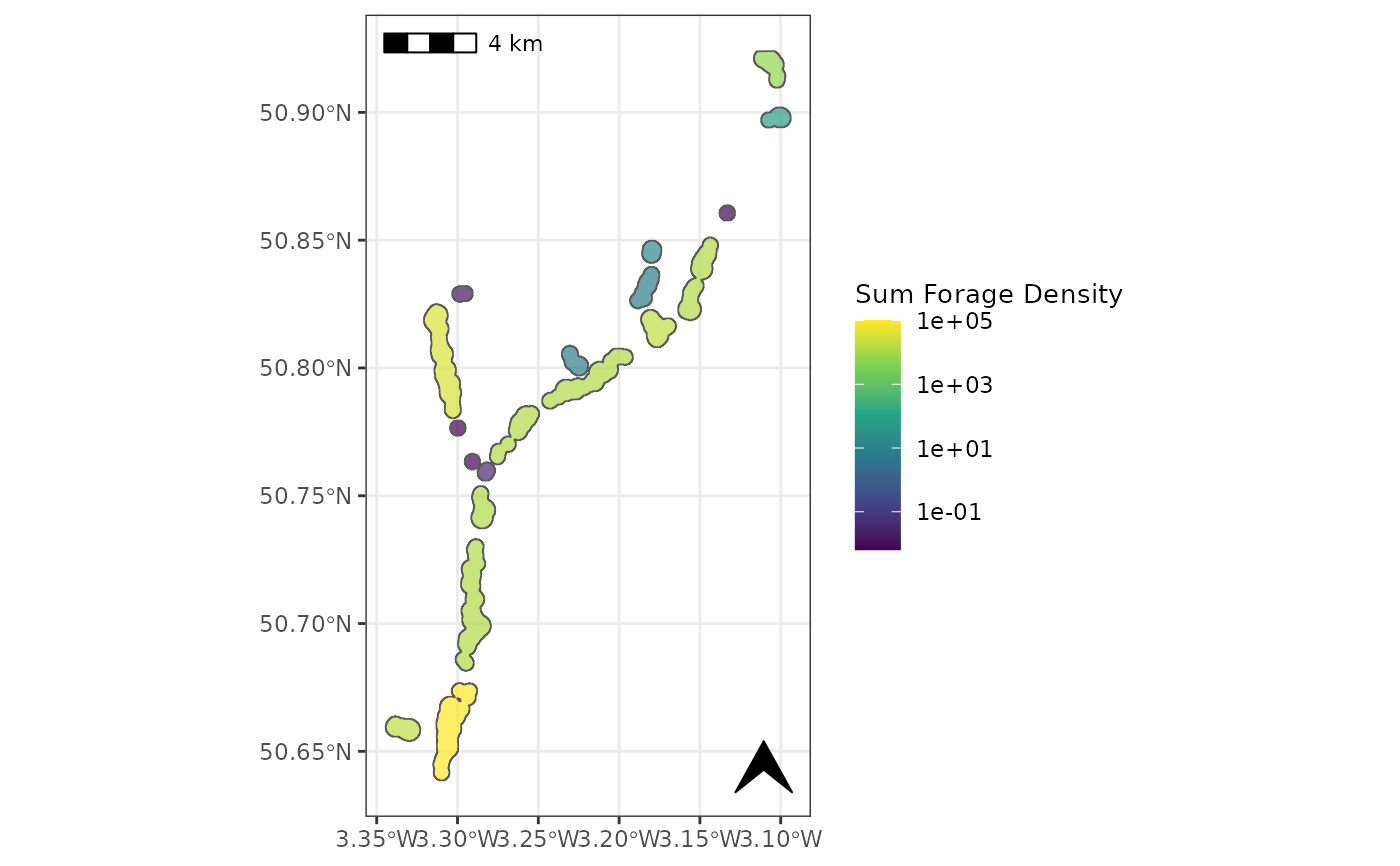
 plot_territories(otter_poly, 'sum_fd', basemap=FALSE, trans_type = 'log10')
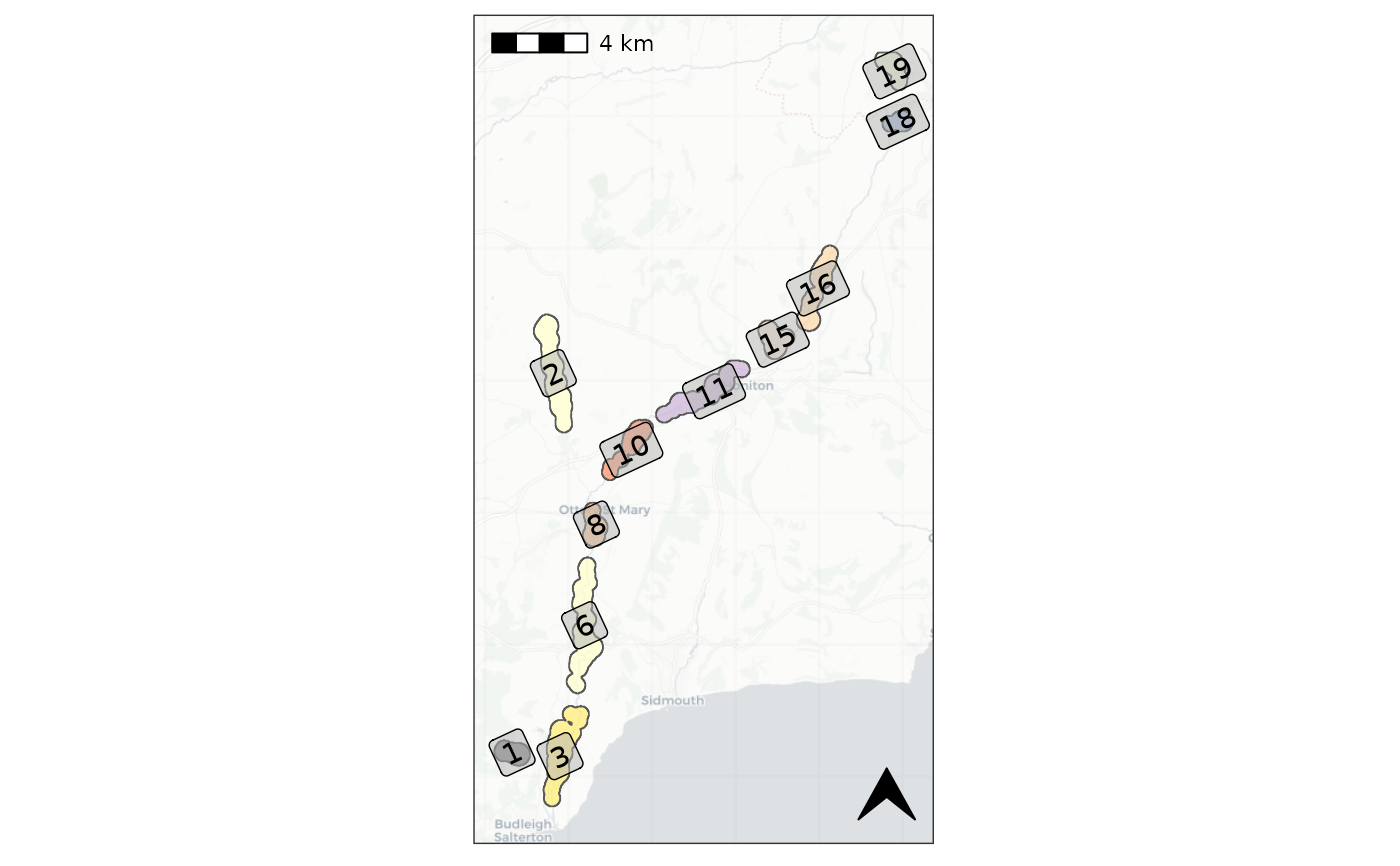
 plot_territories(otter_poly, 'id', basemap=TRUE, guide = FALSE, label = TRUE,
drop_act = TRUE, axes_units = FALSE, rivers = TRUE)
#> "rivers" argument ignored. A valid "catchment" area is required.
#> Zoom: 11
plot_territories(otter_poly, 'id', basemap=TRUE, guide = FALSE, label = TRUE,
drop_act = TRUE, axes_units = FALSE, rivers = TRUE)
#> "rivers" argument ignored. A valid "catchment" area is required.
#> Zoom: 11