Plotting function for feeding/foraging Locations.
plot_feeding.Rdfunction to create a ggplot for the feeding points or confirmatory signs. This is just a lazy wrapper for
beavertools::plot_territories but tidies things up a bit. It is not exaustive and
Usage
plot_feeding(
  beav_points,
  weight_aes = c(1, 3, 6),
  fill_col = c("#1b9e77", "#7570b3", "#d95f02"),
  label = FALSE,
  basemap = TRUE,
  basemap_type = "cartolight",
  axes_units = TRUE,
  scalebar = TRUE,
  scalebar_loc = "tl",
  north_arrow = TRUE,
  north_arrow_loc = "br",
  north_arrow_size = 0.75,
  wgs = TRUE,
  guide = TRUE,
  guide_pos = "bottom",
  seed = NA,
  drop_act = FALSE,
  trans_type = NULL,
  catchment = NULL,
  rivers = FALSE,
  plot_extent = NULL,
  mask_fill = "grey50"
)
Arguments
- beav_points
An 'sf' object containing the location and impact level of beaver foraging signs
- weight_aes
a numeric vector of length 3 or 1. if length is one all points will appear the same size on the plot. where the length equals 3, the value is used as the size aesthetic for points based on their impact category.
- fill_col
character vector of R colours or HEX codes.
- label
label activity areas with polygon ID.
- basemap
Boolean, include an OSM basemap. (optional)
- basemap_type
Character vector for osm map type. for options see
rosm::osm.types()- axes_units
Boolean to include coordinate values on axis.
- scalebar
Boolean to include a scalebar.
- scalebar_loc
character vector for the scalebar location one of:'tl', 'bl', 'tr', 'br' Meaning "top left" etc.
- north_arrow
Boolean to include a north arrow
- north_arrow_loc
character vector for the arrow location one of:'tl', 'bl', 'tr', 'br' Meaning "top left" etc.
- north_arrow_size
numeric vector for the arrow
- wgs
Boolean to transform coordinate reference system (CRS) to WGS84 (EPSG:4326)
- guide
Boolean to include a legend
- guide_pos
character vector describing the desired position of the guide c("left", "right", "bottom", "top")
- seed
numeric seed number -useful if using 'fill_name' = 'ID' as will set the same random colour palette.
- drop_act
Boolean to remove areas classified as 'activity' this creates a plot which shows only possibl and confirmed territories
- trans_type
character - the transformation type to be used if fill_name=c('mean_fd', sum_fd').
- catchment
An sf object or an sf-readable file. See sf::st_drivers() for available drivers. This feature should be a boundary such as a catchment or Area of interest. It is used to mask the map region outside of desired AOI.
- rivers
Boolean to include river lines (downloaded automatcally using the osmdata package) OR a river network of class 'sf' which can be generated beforehand using
beavertools::get_rivers().- plot_extent
'bbox', 'sf' or 'sp' object defining the desired plot extent.
- mask_fill
character vector for the fill colour of the catchment mask.
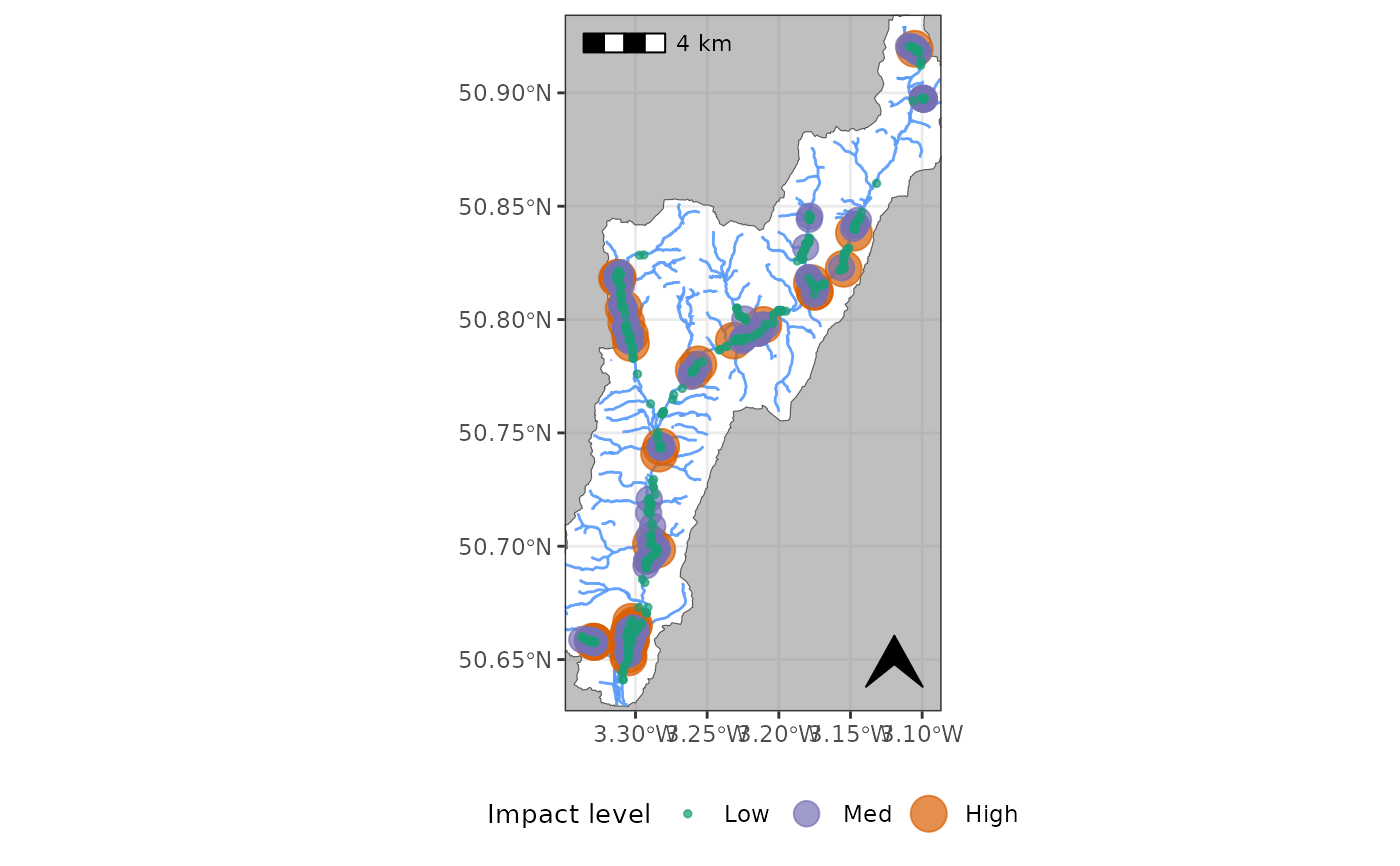
Examples
# Here we filter the filter the built in 2019-2020 ROBT feeding sign data `RivOtter_FeedSigns`
# Then pipe this 'sf' object to plot_feeding.

RivOtter_FeedSigns %>%
dplyr::filter(SurveySeason == "2019 - 2020") %>%
  plot_feeding(., weight_aes=c(1,3,6), basemap=FALSE,
               catchment = RivOtter_Catch_Area, rivers = TRUE)
#> Warning: attribute variables are assumed to be spatially constant throughout all geometries
#> Warning: attribute variables are assumed to be spatially constant throughout all geometries