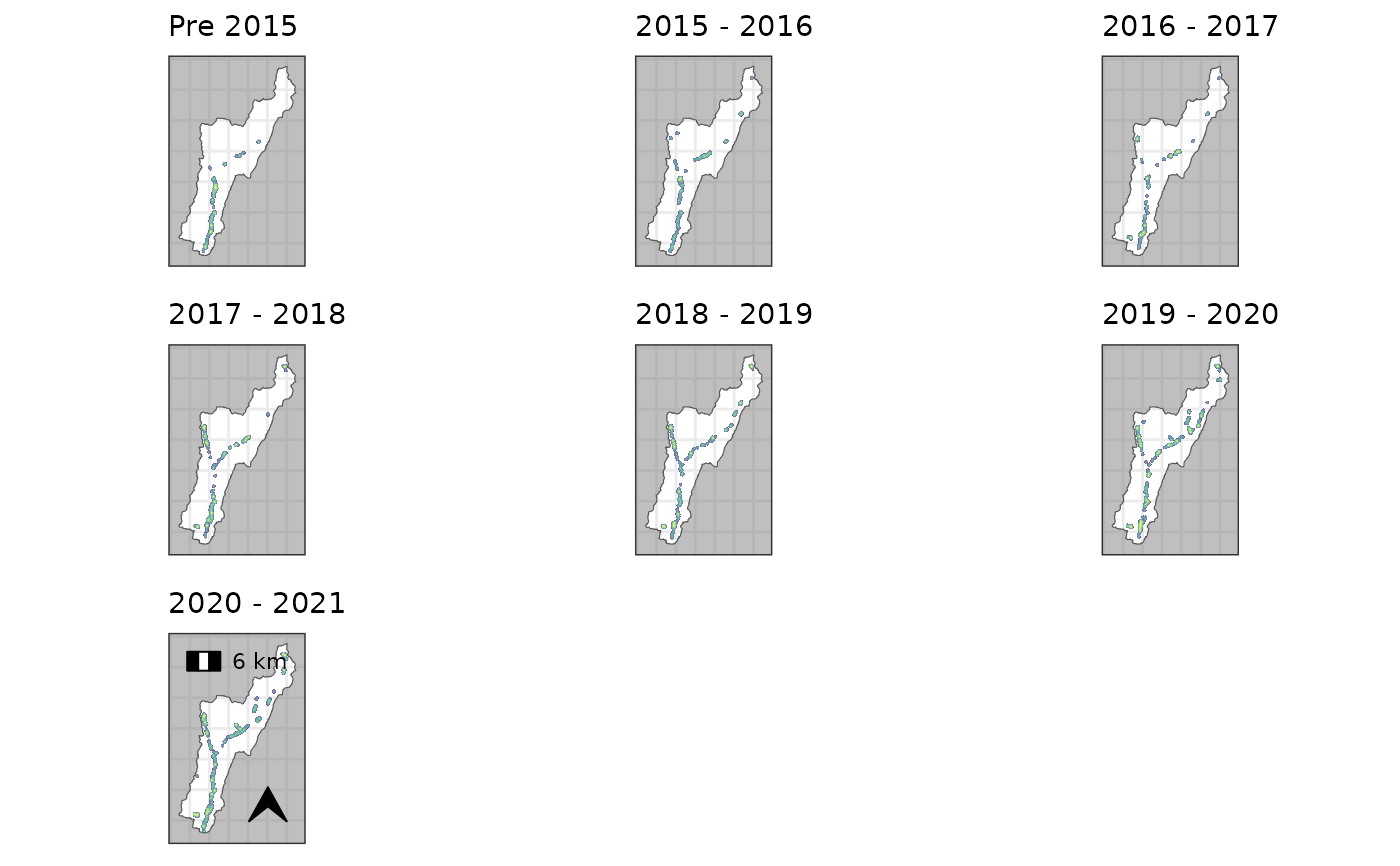
generate a panel plot of multiple maps generated with plot_territories or plot_forage_density
panel_plot.RdFunction to help build a panel plot consisting of multiple plots from different time periods.
Usage
panel_plot(
  terr_plot_list,
  scalebar = TRUE,
  scalebar_loc = "tl",
  north_arrow = TRUE,
  north_arrow_loc = "br",
  north_arrow_size = 0.5,
  guide = FALSE,
  guide_fig_height = c(30, 1),
  n_col = NULL
)
Arguments
- terr_plot_list
list of ggplots generated from either
plot_territoriesorplot_forage_density- scalebar
Boolean to add a scalebar to the last plot in the sequence
- scalebar_loc
character vector to determine the scalebar location on final plot: 'tl', 'bl', 'tr', 'br' Meaning "top left" etc.
- north_arrow
Boolean to add a north arrow to the last plot in the sequence
- north_arrow_loc
character vector to determine the north arrow location on final plot: 'tl', 'bl', 'tr', 'br' Meaning "top left" etc.
- north_arrow_size
numeric to set the size of the north arrow
- guide
Boolean - if TRUE then the legend is extracted from the list of figures and places below the panels
- guide_fig_height
numeric vector length 2 - giving the heights for the figure and lengend objects.
- n_col
integer denoting the number of columns the panel should use. if NULL (the default) the number is generated automatically with
ceiling(sqrt(length(terr_plot_list))).
Examples
#'# kde plots for panel/animation
fsd_ggplot <- function(.data, p.names, p.ext, add_map_stuff= FALSE){

 if (isTRUE(add_map_stuff)){
   fsd <- plot_forage_density(
     .data, basemap = FALSE, guide = FALSE, catchment = RivOtter_Catch_Area,
     rivers = FALSE, plot_extent = p.ext, axes_units = FALSE
   ) +
     ggplot2::labs(subtitle = sprintf('Beaver Foraging Density: %s', p.names))
 } else {
   fsd <- plot_forage_density(
     .data, basemap = FALSE, axes_units = FALSE, north_arrow = FALSE,
     scalebar = FALSE, guide = FALSE, catchment = RivOtter_Catch_Area,
     rivers = FALSE, plot_extent = p.ext
   ) +
     ggplot2::labs(subtitle = p.names)
 }

 return(fsd)
}

# get name list for plots
plot_names <- unique(RivOtter_FeedSigns$SurveySeason)

ras_ext <- inflate_bbox(RivOtter_FeedSigns, 250)

# generate KDE rasters for all survey periods
kde_ras_list <- RivOtter_FeedSigns %>%
  dplyr::group_by(SurveySeason) %>%
  dplyr::group_map(., ~forage_density(., 'FeedCat', kd_extent = ras_ext))
#>
#> calculating weighted kde
#>
#> calculating weighted kde
#>
#> calculating weighted kde
#>
#> calculating weighted kde
#>
#> calculating weighted kde
#>
#> calculating weighted kde
#>
#> calculating weighted kde

# generate panel plot showing sequence of feeding density maps
kde_panel <- kde_ras_list %>%
    purrr::map2(.x=., .y=plot_names, ~fsd_ggplot(.x, .y,
                inflate_bbox(RivOtter_Catch_Area, 200))) %>%
    panel_plot(.)
#> Warning: attribute variables are assumed to be spatially constant throughout all geometries
#> Warning: The `<scale>` argument of `guides()` cannot be `FALSE`. Use "none" instead as
#> of ggplot2 3.3.4.
#> ℹ The deprecated feature was likely used in the beavertools package.
#>   Please report the issue to the authors.
#> Warning: attribute variables are assumed to be spatially constant throughout all geometries
#> Warning: attribute variables are assumed to be spatially constant throughout all geometries
#> Warning: attribute variables are assumed to be spatially constant throughout all geometries
#> Warning: attribute variables are assumed to be spatially constant throughout all geometries
#> Warning: attribute variables are assumed to be spatially constant throughout all geometries
#> Warning: attribute variables are assumed to be spatially constant throughout all geometries
#> Warning: Removed 1700327 rows containing missing values or values outside the scale
#> range (`geom_raster()`).
#> Warning: Removed 1688858 rows containing missing values or values outside the scale
#> range (`geom_raster()`).
#> Warning: Removed 1692974 rows containing missing values or values outside the scale
#> range (`geom_raster()`).
#> Warning: Removed 1678227 rows containing missing values or values outside the scale
#> range (`geom_raster()`).
#> Warning: Removed 1667168 rows containing missing values or values outside the scale
#> range (`geom_raster()`).
#> Warning: Removed 1648380 rows containing missing values or values outside the scale
#> range (`geom_raster()`).
#> Warning: Removed 1642769 rows containing missing values or values outside the scale
#> range (`geom_raster()`).